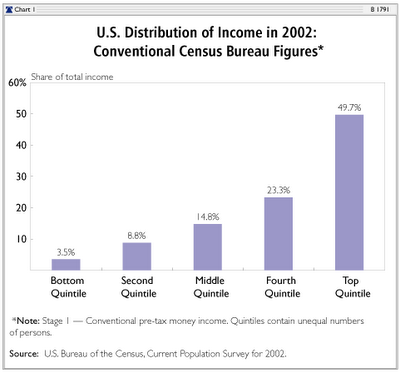
The Heritage Foundation’s Robert Rector and Rea Hederman, Jr. in August 2004 answered income inequality arguments, arguments based on the Census Bureau’s annual income distribution figures (see chart above):
In 2002, the Census reported that the top fifth of households had 49.7 percent of income, while the bottom fifth had only 3.5 percent. Thus, the top appeared to have $14.20 of income for every $1.00 at the bottom. . .
The Census figures [are] misleading. . . [I]n 2002, government spent over $500 billion on means-tested welfare (including cash, food, housing, and medical care) for the poor and near poor and over $250 billion subsidizing medical care for the elderly through Medicare. . . a mammoth transfer of resources from those who work a lot to those who work less or not at all. . . not reflected in conventional Census income inequality figures. . .When taxes and benefits are counted, the . . . top fifth has $8.60 for each $1.00 at the bottom.
But . . . [while] Census fifths . . . contain the same number of households, [those] at the bottom have few people while those at the top are large and have multiple earners. [So the bottom fifth] has only 14 percent of the population while the top quintile has 25 percent. [If] each fifth contain[ed] an equal number of people. . . The post-tax/post-benefit income of the bottom rises to 9.4 percent of income while the top drops to 39.6 percent. [Now], the top fifth has $4.20 of income for each $1.00 at the bottom.
[Beyond that, the Census Bureau found] the top quintile of households performs over a third of all paid labor, while the bottom performs only 4.3 percent. . . due in part to a shortage of working-age adults within the bottom quintile, [and because] non-elderly adults at the bottom, on average, work half as many hours per month as do their higher-income counterparts. If the quintiles are adjusted [so that those] at the bottom work as many hours as adults in the rest of society, the . . . top quintile would have only $2.91 in income for every $1.00 at the bottom (see chart below).
[Finally, is income] distribution . . . becoming less equal over time? . . . In 2002, after adjusting quintiles to contain equal numbers of persons, the ratio of the income of the top quintile compared to the bottom quintile was exactly the same as in 1997.
The top fifth of U.S. households (with incomes above $84,000) . . ., many with two or more earners. . . pay 82.5 percent of total federal income taxes and two-thirds of federal taxes overall. The bottom quintile pays 1.1 percent of total federal taxes.


No comments:
Post a Comment